There are currently five types of chart functions that can display charts in a diagnosis: RADAR, LINE, PIE, BAR, and SCATTER. We are pleased to see that all of you have created many interesting diagnoses using these chart functions.
We have now added a new type of chart function called TABLE, which you can use to create TABLE charts.
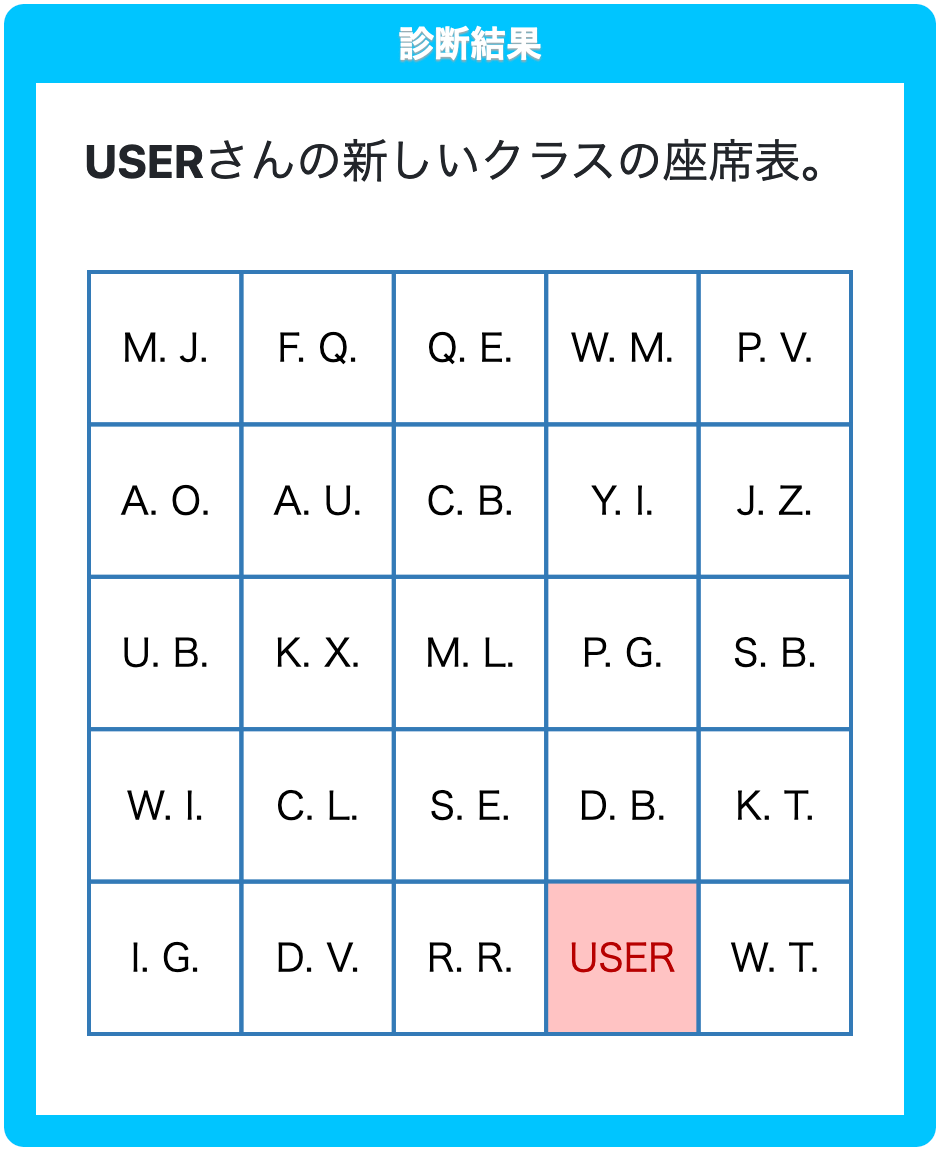
"TABLE chart" is a function that allows you to generate tables containing up to 10 rows and 10 columns as images.
You can also change the borders of the table, as well as the text and background colors for individual cells.
Sample diagnoses featuring the use of this TABLE chart can be found here.
Also, sample data for creating diagnoses is available at this link. We hope you will find it useful.
We look forward to your continued support of ShindanMaker.